Journals > > Topics > Atmospheric Optics and Oceanic Optics
Atmospheric Optics and Oceanic Optics|688 Article(s)
Observation Method of Microphysical Parameters of Ice Crystals in Cloud Based on Digital Holography
Chenyu Yang, Jun Wang, Chuan Zhang, Hao Zhou, Junsheng Yang, Zhiguo Yue, Gu Liang, Jingjing Liu, and Dengxin Hua
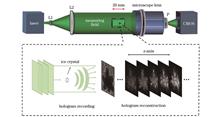
ObjectiveAs an important component of the cloud droplet spectrum, ice crystals exert important effects on global radiation budget balance, global climate change, hydrological cycle, and weather modification. Due to the limitation of observation means, the understanding about the microphysical characteristics of ice crystal particles is not perfect till now. At present, it is difficult to identify the mixed phase of 2-100 μm ice crystals from droplets, and there is a bottleneck to provide microphysical parameters of ice crystals. The lack of sufficient ice crystal detection data can cause large differences in the mean value of ice water paths in different models, especially in mixed-phase clouds. Therefore, we study the microphysical parameters of ice crystals.MethodsFor these two problems, based on the digital holography theory, we propose to employ the global digital image fusion method, the local Tenengrad variance method, and the rotating caliper method for identifying mixed phase states of droplets and ice crystals in the cloud by combining the roundness concept of solid and liquid particles. Combined with optical image recognition technology, we obtain the area, perimeter, convex hull, and minimum enclosing rectangle data of ice crystals. Finally, the microphysical parameters of ice crystals are acquired by adopting the above data. The microphysical parameters of plate, dendritic and hexagonal ice crystals are obtained by observation experiments in low-temperature cloud chambers.Results and DiscussionsSome obvious conclusions can be obtained by adopting the proposed method. 1) By leveraging the rotating caliper method and the specific geometric parameter roundness F, the mixed phase identification of droplets and ice crystals in clouds is realized. Under the specific roundness threshold, the recognition rate of droplets and ice crystals is greater than 93% (Fig. 8). 2) Combined with optical image recognition technology, morphological data (the area, perimeter, convex hull, and minimum enclosing rectangle data) of ice crystal particles are obtained (Table 1). 3) The microphysical parameters of ice crystals are acquired by morphological data of ice crystals (Table 2). 4) When the digital hologram of ice crystal particles is obtained with the frequency of 30 frame/s, the three-dimensional kinetic velocity of ice crystal particles can also be acquired by this method (Fig. 11).ConclusionsAn ice crystal detection method based on a pulse-modulated laser, high-resolution optical system, and coaxial digital holography (DH) is presented. The local Tenengrad variance method, the rotating caliper method, and the specific geometric parameter roundness F are adopted for phase state identification of particles. To verify the validity of the detection method and identification algorithm, we observe the mixed particles of droplets and ice crystals in the cloud chamber. Additionally, the three-dimensional motion velocity and trajectory of ice crystals can be obtained from the sampling interval time and the three-dimensional coordinates and equivalent diameters of the center of mass at different time. This method solves the bottleneck problem that the existing observation technology cannot identify the phase states and obtain the microphysical parameters of ice crystals. Meanwhile, the method is of significance to improve the accuracy of numerical weather prediction and weather modification operation. ObjectiveAs an important component of the cloud droplet spectrum, ice crystals exert important effects on global radiation budget balance, global climate change, hydrological cycle, and weather modification. Due to the limitation of observation means, the understanding about the microphysical characteristics of ice crystal particles is not perfect till now. At present, it is difficult to identify the mixed phase of 2-100 μm ice crystals from droplets, and there is a bottleneck to provide microphysical parameters of ice crystals. The lack of sufficient ice crystal detection data can cause large differences in the mean value of ice water paths in different models, especially in mixed-phase clouds. Therefore, we study the microphysical parameters of ice crystals.MethodsFor these two problems, based on the digital holography theory, we propose to employ the global digital image fusion method, the local Tenengrad variance method, and the rotating caliper method for identifying mixed phase states of droplets and ice crystals in the cloud by combining the roundness concept of solid and liquid particles. Combined with optical image recognition technology, we obtain the area, perimeter, convex hull, and minimum enclosing rectangle data of ice crystals. Finally, the microphysical parameters of ice crystals are acquired by adopting the above data. The microphysical parameters of plate, dendritic and hexagonal ice crystals are obtained by observation experiments in low-temperature cloud chambers.Results and DiscussionsSome obvious conclusions can be obtained by adopting the proposed method. 1) By leveraging the rotating caliper method and the specific geometric parameter roundness F, the mixed phase identification of droplets and ice crystals in clouds is realized. Under the specific roundness threshold, the recognition rate of droplets and ice crystals is greater than 93% (Fig. 8). 2) Combined with optical image recognition technology, morphological data (the area, perimeter, convex hull, and minimum enclosing rectangle data) of ice crystal particles are obtained (Table 1). 3) The microphysical parameters of ice crystals are acquired by morphological data of ice crystals (Table 2). 4) When the digital hologram of ice crystal particles is obtained with the frequency of 30 frame/s, the three-dimensional kinetic velocity of ice crystal particles can also be acquired by this method (Fig. 11).ConclusionsAn ice crystal detection method based on a pulse-modulated laser, high-resolution optical system, and coaxial digital holography (DH) is presented. The local Tenengrad variance method, the rotating caliper method, and the specific geometric parameter roundness F are adopted for phase state identification of particles. To verify the validity of the detection method and identification algorithm, we observe the mixed particles of droplets and ice crystals in the cloud chamber. Additionally, the three-dimensional motion velocity and trajectory of ice crystals can be obtained from the sampling interval time and the three-dimensional coordinates and equivalent diameters of the center of mass at different time. This method solves the bottleneck problem that the existing observation technology cannot identify the phase states and obtain the microphysical parameters of ice crystals. Meanwhile, the method is of significance to improve the accuracy of numerical weather prediction and weather modification operation.
Acta Optica Sinica
- Publication Date: Mar. 25, 2024
- Vol. 44, Issue 6, 0601017 (2024)

Influence of Aerosol Optical Properties on Retrieval Results of NO2 Mass Concentration in Broadband Differential Absorption Lidar
Yuan Cheng, Jiheng Yu, Zhenfeng Gong, and Liang Mei
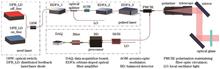
ObjectiveAccurate monitoring of nitrogen dioxide (NO2), a significant atmospheric pollutant, is essential for effective environmental management. Differential absorption lidar (DIAL) technology has emerged as a robust approach to address this challenge. However, the wavelength dependency of aerosol optical properties has a substantial impact on NO2-DIAL measurements. Previous studies mostly focus on the narrow-band NO2-DIAL technique without considering the spectral width of the emitted laser pulse. Therefore, the influence of aerosol optical properties on the retrieved NO2 mass concentration of the broad-band DIAL technique remains unclear. We aim to investigate aerosol-induced NO2 mass concentration errors under various atmospheric conditions through simulation studies and an approximation method for the broadband NO2-DIAL technique. We hope that this research can offer valuable insights into comprehending the influence of aerosol optical properties on broadband NO2-DIAL techniques.MethodsWe carry out research based on the broadband NO2-DIAL technique (Fig. 1) employing the Scheimpflug principle. The broadband NO2-DIAL system utilizes image sensors as detectors and high-power laser diodes as light sources (wavelength is 450 nm, power is 1.6 W), with an emission spectral typically ranging from 1-2 nm (full width at half maximum). Two different methods (the simulation method and the approximation method) have been adopted to elucidate the influence of atmospheric aerosols on the broadband NO2-DIAL technique. The broadband DIAL equation has been established, based on which simulated atmospheric lidar signals can be obtained with measured laser spectra and different atmospheric parameters, e.g., aerosol extinction coefficient, backscattering coefficient and ?ngstr?m exponent (Fig. 5). Therefore, the NO2 mass concentration containing the aerosol-induced retrieval errors can be acquired through segmented fitting for the simulated atmospheric lidar signals (Fig. 6). As a result, the NO2 mass concentration errors introduced by the aerosol extinction effect and the aerosol backscattering effect under various atmospheric conditions can be obtained through numerical calculation. Besides, the aerosol-induced NO2 mass concentration errors can also be mathematically derived based on spectral approximation—the approximation method. Meanwhile, cross-validations between the aerosol-induced NO2 mass concentration errors obtained from these two methods have also been carried out.Results and DiscussionsSeveral conclusions can be drawn according to simulation studies. When the atmospheric condition is homogeneous, for an extinction coefficient of 0.3 km-1 and an ?ngstr?m exponent of 3, the aerosol-induced retrieval error of the NO2 mass concentration is 14.7 μg/m3, while the error introduced by the aerosol backscattering effect is only about 0.6 μg/m3 (Fig.7). Therefore, when atmospheric aerosols are homogeneously distributed, the inversion error of NO2 mass concentration mainly depends on the aerosol extinction coefficient. The proportion of the NO2 mass concentration inversion error generated by the backscattering effect is generally less than 5%, which can be ignored. Besides, if the ?ngstr?m exponent approaches 1, the NO2 mass concentration error introduced by the aerosol extinction effect will decrease to 5 μg/m3 (Fig. 9). If aerosol plumes appear in a homogeneous atmosphere (0.3 km-1), for the extinction coefficient of 0.66 km?1 within the inhomogeneous range and an ?ngstr?m exponent of 3, the NO2 mass concentration error resulted from the aerosol extinction coefficient in the inhomogeneous region is 18.9 μg/m3. However, the error introduced by the aerosol backscattering effect increases to 3.3 μg/m3 with a fitting distance of 500 m (Fig. 11). Under typical weather conditions with a relatively small ?ngstr?m exponent of 1, the NO2 mass concentration error introduced by the aerosol backscattering effect will increase to 6.8 μg/m3 (Fig. 12). The simulation results indicate that the inversion error of aerosol backscattering effect on NO2 mass concentration largely depends on the non-uniformity of atmospheric aerosol distribution, the fitting range, etc. Meanwhile, increasing the fitting range can greatly reduce the NO2 mass concentration error introduced by the aerosol, especially for the backscattering effects. Comparison studies between the approximation method and the simulation method reveal that the NO2 mass concentration retrieval error introduced by the extinction effect is almost the same, while the backscattering coefficient-induced errors may be quite different (Figs. 13 and 14).ConclusionsWe evaluate the measurement errors of NO2 mass concentration caused by aerosol extinction and backscattering effects under various atmospheric conditions by two different methods (the simulation method and the approximation method) for the broadband NO2-DIAL technique. In the case of a homogeneous atmosphere, the NO2 mass concentration error is primarily determined by the aerosol extinction coefficient, while the contribution from aerosol backscattering effects can be neglected. However, if the atmosphere is inhomogeneous, the NO2 mass concentration error caused by the aerosol backscattering effect is significantly influenced by the inhomogeneous distribution of aerosol. It should be mentioned that the backscattering coefficient-induced NO2 mass concentration error is inversely proportional to the ?ngstr?m exponent in this case. In addition, we also derive an approximation model for NO2 mass concentration inversion errors caused by the extinction and backscattering coefficients based on spectral approximation. The comparison between the approximation method and the simulation method shows that the NO2 mass concentration inversion error generated by the extinction coefficients obtained by the two methods are generally in good agreement with small discrepancies. The inversion error caused by the aerosol backscattering coefficient may be affected by factors such as the computation method, the fitting range, and the spectral approximation. The approximation model provides an important tool for evaluating NO2 mass concentration errors in practical DIAL measurements. ObjectiveAccurate monitoring of nitrogen dioxide (NO2), a significant atmospheric pollutant, is essential for effective environmental management. Differential absorption lidar (DIAL) technology has emerged as a robust approach to address this challenge. However, the wavelength dependency of aerosol optical properties has a substantial impact on NO2-DIAL measurements. Previous studies mostly focus on the narrow-band NO2-DIAL technique without considering the spectral width of the emitted laser pulse. Therefore, the influence of aerosol optical properties on the retrieved NO2 mass concentration of the broad-band DIAL technique remains unclear. We aim to investigate aerosol-induced NO2 mass concentration errors under various atmospheric conditions through simulation studies and an approximation method for the broadband NO2-DIAL technique. We hope that this research can offer valuable insights into comprehending the influence of aerosol optical properties on broadband NO2-DIAL techniques.MethodsWe carry out research based on the broadband NO2-DIAL technique (Fig. 1) employing the Scheimpflug principle. The broadband NO2-DIAL system utilizes image sensors as detectors and high-power laser diodes as light sources (wavelength is 450 nm, power is 1.6 W), with an emission spectral typically ranging from 1-2 nm (full width at half maximum). Two different methods (the simulation method and the approximation method) have been adopted to elucidate the influence of atmospheric aerosols on the broadband NO2-DIAL technique. The broadband DIAL equation has been established, based on which simulated atmospheric lidar signals can be obtained with measured laser spectra and different atmospheric parameters, e.g., aerosol extinction coefficient, backscattering coefficient and ?ngstr?m exponent (Fig. 5). Therefore, the NO2 mass concentration containing the aerosol-induced retrieval errors can be acquired through segmented fitting for the simulated atmospheric lidar signals (Fig. 6). As a result, the NO2 mass concentration errors introduced by the aerosol extinction effect and the aerosol backscattering effect under various atmospheric conditions can be obtained through numerical calculation. Besides, the aerosol-induced NO2 mass concentration errors can also be mathematically derived based on spectral approximation—the approximation method. Meanwhile, cross-validations between the aerosol-induced NO2 mass concentration errors obtained from these two methods have also been carried out.Results and DiscussionsSeveral conclusions can be drawn according to simulation studies. When the atmospheric condition is homogeneous, for an extinction coefficient of 0.3 km-1 and an ?ngstr?m exponent of 3, the aerosol-induced retrieval error of the NO2 mass concentration is 14.7 μg/m3, while the error introduced by the aerosol backscattering effect is only about 0.6 μg/m3 (Fig.7). Therefore, when atmospheric aerosols are homogeneously distributed, the inversion error of NO2 mass concentration mainly depends on the aerosol extinction coefficient. The proportion of the NO2 mass concentration inversion error generated by the backscattering effect is generally less than 5%, which can be ignored. Besides, if the ?ngstr?m exponent approaches 1, the NO2 mass concentration error introduced by the aerosol extinction effect will decrease to 5 μg/m3 (Fig. 9). If aerosol plumes appear in a homogeneous atmosphere (0.3 km-1), for the extinction coefficient of 0.66 km?1 within the inhomogeneous range and an ?ngstr?m exponent of 3, the NO2 mass concentration error resulted from the aerosol extinction coefficient in the inhomogeneous region is 18.9 μg/m3. However, the error introduced by the aerosol backscattering effect increases to 3.3 μg/m3 with a fitting distance of 500 m (Fig. 11). Under typical weather conditions with a relatively small ?ngstr?m exponent of 1, the NO2 mass concentration error introduced by the aerosol backscattering effect will increase to 6.8 μg/m3 (Fig. 12). The simulation results indicate that the inversion error of aerosol backscattering effect on NO2 mass concentration largely depends on the non-uniformity of atmospheric aerosol distribution, the fitting range, etc. Meanwhile, increasing the fitting range can greatly reduce the NO2 mass concentration error introduced by the aerosol, especially for the backscattering effects. Comparison studies between the approximation method and the simulation method reveal that the NO2 mass concentration retrieval error introduced by the extinction effect is almost the same, while the backscattering coefficient-induced errors may be quite different (Figs. 13 and 14).ConclusionsWe evaluate the measurement errors of NO2 mass concentration caused by aerosol extinction and backscattering effects under various atmospheric conditions by two different methods (the simulation method and the approximation method) for the broadband NO2-DIAL technique. In the case of a homogeneous atmosphere, the NO2 mass concentration error is primarily determined by the aerosol extinction coefficient, while the contribution from aerosol backscattering effects can be neglected. However, if the atmosphere is inhomogeneous, the NO2 mass concentration error caused by the aerosol backscattering effect is significantly influenced by the inhomogeneous distribution of aerosol. It should be mentioned that the backscattering coefficient-induced NO2 mass concentration error is inversely proportional to the ?ngstr?m exponent in this case. In addition, we also derive an approximation model for NO2 mass concentration inversion errors caused by the extinction and backscattering coefficients based on spectral approximation. The comparison between the approximation method and the simulation method shows that the NO2 mass concentration inversion error generated by the extinction coefficients obtained by the two methods are generally in good agreement with small discrepancies. The inversion error caused by the aerosol backscattering coefficient may be affected by factors such as the computation method, the fitting range, and the spectral approximation. The approximation model provides an important tool for evaluating NO2 mass concentration errors in practical DIAL measurements.
Acta Optica Sinica
- Publication Date: Mar. 25, 2024
- Vol. 44, Issue 6, 0601016 (2024)
Non-Blind Zone Detection of Atmospheric Temperature Using Lateral Raman Scattering Lidar Based on Continuous-Wave Laser
Fan Yang, Fei Gao, Xiong Gao, Xiaoli Li, Li Wang, Qing Yan, Dongchen Shi, Yuehui Song, Shichun Li, and Dengxin Hua
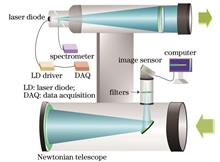
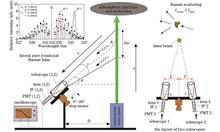
ObjectivePure rotational Raman scattering lidar is an important remote sensing tool for atmospheric temperature measurement. However, traditional backward pure rotational Raman scattering lidar has limitations in achieving effective atmospheric temperature detection in the lower atmosphere due to the overlap function effect of lidar systems. We present a novel technique of lateral scanning pure rotational Raman scattering lidar for accurate measurement of atmospheric temperature without the influence of blind zones and transition zones, which employs the bistatic structure of lidar systems. The atmospheric temperature profiling is realized by the detection of high- and low-quantum-number transitions of lateral pure rotational Raman scattering spectra at different heights, which is performed by elevation angle scanning of the lateral receiver system. The biggest advantage of this technique is the utilization of continuous-wave lasers as the excitation source, which not only significantly reduces equipment costs but also facilitates convenient mobility for outdoor observations.MethodsThe lateral pure rotational Raman scattering lidar technique is studied in the accurate measurement applications of atmospheric temperature from the ground to the height of interest. First, a novel lateral scanning pure rotational Raman scattering lidar technique is proposed and systematically designed. Each telescope combined with a narrow-band interferometric filter is adopted to detect the lateral scattering signals of the low- and high-quantum-number transitions of pure rotational Raman scattering spectra. Then, the atmospheric temperature inversion algorithm for lateral scanning pure rotational Raman scattering lidar is established and the calibration function is optimized to improve the inversion accuracy of atmospheric temperature. Finally, the experimental system is constructed, and the preliminary experiments are conducted using the lateral scanning pure rotational Raman scattering lidar. Two different rotation schemes including the continuous equidistant resolution and segmented equidistant resolution are employed during the experimental observations.Results and DiscussionsThe detection principle of the proposed Raman scattering lidar is innovatively presented. It breaks through the traditional backward pure rotational Raman scattering lidar using a monostatic transceiver system structure, which produces blind and transition zones that cannot realize effective detection of near-surface atmospheric temperature. Meanwhile, this technology can leverage a continuous-wave laser, which features light weight, portability, mobility, and low cost (Fig. 1). By analyzing the eight newly expanded calibration functions, the calibration function that introduces the smallest error is selected as the expression for atmospheric temperature detection by a lateral pure rotational Raman scattering lidar (Fig. 2). Based on completing the lateral pure rotational Raman scattering lidar system design, the lateral Raman scattering lidar system is constructed (Fig. 3). Preliminary experimental observational studies of a lateral scanning pure rotational Raman scattering lidar are performed by two different rotation schemes of the continuous equidistant resolution and segmented equidistant resolution, which are employed during the experimental observations. The experimental results show that the lateral scanning pure rotational Raman scattering lidar has precise detection capability of atmospheric temperature up to a height of 1400 m. Furthermore, the segmented equidistant resolution rotation scheme provides a finer spatial distribution of temperature within the height interval of 0-312 m (Figs. 4-7),compared with the continuous equidistant resolution rotation scheme.ConclusionsWe propose a novel lateral pure rotational Raman scattering lidar technique to realize non-blind detection of the temperature profile distribution in the lower atmosphere. The profiling of lidar returns in the lateral pure rotational Raman scattering lidar is performed by elevation angle scanning of the lateral receiving system. Meanwhile, the intensities of the lateral Raman scattering signals at each setting of elevation angles are sampled and analyzed, and the biggest advantage of this technique is that a low-cost continuous laser can be employed as the excitation light source to simplify the system and reduce costs. Additionally, the pulsed laser in the backward pure rotational Raman scattering lidar can be adopted as the transmitter to construct a lateral + backward pure rotational Raman scattering lidar for finely detecting the atmospheric temperature from the ground to the height of interest. The preliminary experimental results show that the atmospheric temperature below the height of 1400 m can be detected finely with the 60 m distance between the transmitter and receiver. The segmented equidistant resolution rotational scheme can realize a more refined temperature profile than the whole continuous equidistant resolution rotation scheme. ObjectivePure rotational Raman scattering lidar is an important remote sensing tool for atmospheric temperature measurement. However, traditional backward pure rotational Raman scattering lidar has limitations in achieving effective atmospheric temperature detection in the lower atmosphere due to the overlap function effect of lidar systems. We present a novel technique of lateral scanning pure rotational Raman scattering lidar for accurate measurement of atmospheric temperature without the influence of blind zones and transition zones, which employs the bistatic structure of lidar systems. The atmospheric temperature profiling is realized by the detection of high- and low-quantum-number transitions of lateral pure rotational Raman scattering spectra at different heights, which is performed by elevation angle scanning of the lateral receiver system. The biggest advantage of this technique is the utilization of continuous-wave lasers as the excitation source, which not only significantly reduces equipment costs but also facilitates convenient mobility for outdoor observations.MethodsThe lateral pure rotational Raman scattering lidar technique is studied in the accurate measurement applications of atmospheric temperature from the ground to the height of interest. First, a novel lateral scanning pure rotational Raman scattering lidar technique is proposed and systematically designed. Each telescope combined with a narrow-band interferometric filter is adopted to detect the lateral scattering signals of the low- and high-quantum-number transitions of pure rotational Raman scattering spectra. Then, the atmospheric temperature inversion algorithm for lateral scanning pure rotational Raman scattering lidar is established and the calibration function is optimized to improve the inversion accuracy of atmospheric temperature. Finally, the experimental system is constructed, and the preliminary experiments are conducted using the lateral scanning pure rotational Raman scattering lidar. Two different rotation schemes including the continuous equidistant resolution and segmented equidistant resolution are employed during the experimental observations.Results and DiscussionsThe detection principle of the proposed Raman scattering lidar is innovatively presented. It breaks through the traditional backward pure rotational Raman scattering lidar using a monostatic transceiver system structure, which produces blind and transition zones that cannot realize effective detection of near-surface atmospheric temperature. Meanwhile, this technology can leverage a continuous-wave laser, which features light weight, portability, mobility, and low cost (Fig. 1). By analyzing the eight newly expanded calibration functions, the calibration function that introduces the smallest error is selected as the expression for atmospheric temperature detection by a lateral pure rotational Raman scattering lidar (Fig. 2). Based on completing the lateral pure rotational Raman scattering lidar system design, the lateral Raman scattering lidar system is constructed (Fig. 3). Preliminary experimental observational studies of a lateral scanning pure rotational Raman scattering lidar are performed by two different rotation schemes of the continuous equidistant resolution and segmented equidistant resolution, which are employed during the experimental observations. The experimental results show that the lateral scanning pure rotational Raman scattering lidar has precise detection capability of atmospheric temperature up to a height of 1400 m. Furthermore, the segmented equidistant resolution rotation scheme provides a finer spatial distribution of temperature within the height interval of 0-312 m (Figs. 4-7),compared with the continuous equidistant resolution rotation scheme.ConclusionsWe propose a novel lateral pure rotational Raman scattering lidar technique to realize non-blind detection of the temperature profile distribution in the lower atmosphere. The profiling of lidar returns in the lateral pure rotational Raman scattering lidar is performed by elevation angle scanning of the lateral receiving system. Meanwhile, the intensities of the lateral Raman scattering signals at each setting of elevation angles are sampled and analyzed, and the biggest advantage of this technique is that a low-cost continuous laser can be employed as the excitation light source to simplify the system and reduce costs. Additionally, the pulsed laser in the backward pure rotational Raman scattering lidar can be adopted as the transmitter to construct a lateral + backward pure rotational Raman scattering lidar for finely detecting the atmospheric temperature from the ground to the height of interest. The preliminary experimental results show that the atmospheric temperature below the height of 1400 m can be detected finely with the 60 m distance between the transmitter and receiver. The segmented equidistant resolution rotational scheme can realize a more refined temperature profile than the whole continuous equidistant resolution rotation scheme.
Acta Optica Sinica
- Publication Date: Mar. 25, 2024
- Vol. 44, Issue 6, 0601015 (2024)
Retrieval of Aerosol Particle Size Distribution from Multi-Wavelength Lidar
Xiaotao Li, Dong Liu, Da Xiao, Kai Zhang, Xianzhe Hu, Weize Li, Lei Bi, Wenbo Sun, Lan Wu, Chong Liu, and Jiesong Deng
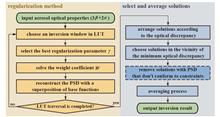
ObjectiveAtmospheric aerosols play a crucial role in climate change and atmospheric pollution. Multi-wavelength Raman lidars and lidars with high spectral resolution can accurately measure aerosol extinction and backscatter coefficients for retrieving aerosol particle size distribution, volume concentration, effective radius, and other microphysical properties, which is significant for studying regional and global ecological environments. However, retrieval errors exist in the extinction and backscattering coefficients detected by lidars. When the aerosol microphysical properties are retrieved, the number of unknown parameters required to be solved is often greater than that of optical measurement channels, which is a typical ill-posed inverse problem. As the retrieved results show significant uncertainty in some cases, additional constraints should be introduced to improve the retrieval stability. We propose an advanced regularization retrieval algorithm that introduces a priori mode radius range as a constraint to improve the retrieval accuracy of particle size distribution parameters of different aerosol types.MethodsIn our study, an advanced retrieval algorithm for aerosol microphysical properties based on the regularization method is developed. The entire algorithm process is shown in Fig. 1. Based on the Tikhonov regularization retrieval, the reliable retrieval of microphysical particle properties can be realized with a combined data set of particle backscattering coefficients at 355, 532, and 1064 nm and extinction coefficients at 355 nm and 532 nm. Generally, only those solutions for which the optical discrepancy term takes its minimum are selected in retrieval, but here all individual solutions that are within a certain range around this minimum solution are averaged. As a result, the retrieval stability can be improved. Additionally, referring to the aerosol models from the AERONET database, we obtain the volume mode radius ranges of coarse and fine mode aerosols. By employing this as a priori constraint, further selection is performed on the reconstructed particle size distribution to obtain the final retrieved results after averaging.Results and DiscussionsTo test the effectiveness of a priori mode radius constraints on improving the retrieval accuracy of particle size distribution, we conduct the simulations of four typical tropospheric aerosol types: (i) urban aerosols, (ii) smoke aerosols, (iii) desert dust aerosols, and (iv) marine aerosols, with parameters derived from observation data from several AERONET stations. Fig. 2 compares the distribution changes of reconstructed particle sizes after introducing a priori constraints. Meanwhile, Table 2 quantitatively compares the results in Fig. 2 by adopting mean relative errors as the evaluation index. The comparison results indicate that introducing mode radius constraints significantly improves the retrieval results of coarse mode aerosols. Referring to the range of aerosol microphysical parameters (Table 3) given in historical data, we generate 1500 sets of bimodal log-normal distribution data to test the algorithm. Considering the effect of 20% random Gaussian noise, the relative errors of the retrieved effective radius, volume concentration, and surface area concentration are controlled within the range of ±33%,±45%,and ±50% respectively in the cases over 90%. This indicates that the algorithm has sound stability and can tolerate input error effects within a certain range.ConclusionsWe propose an advanced retrieval algorithm for aerosol microphysical properties based on the regularization method, which significantly improves the stability and accuracy of retrieval and solves the problem of large retrieved errors in some cases. The proposed algorithm improves the remote detection technology of aerosols by multi-wavelength lidars. These measurements can provide accurate information about aerosol microphysical properties. The vertical profile of aerosol parameters obtained from lidar detection can be a great improvement of aerosol modeling, which will help study the influence of aerosols on climate and environment. ObjectiveAtmospheric aerosols play a crucial role in climate change and atmospheric pollution. Multi-wavelength Raman lidars and lidars with high spectral resolution can accurately measure aerosol extinction and backscatter coefficients for retrieving aerosol particle size distribution, volume concentration, effective radius, and other microphysical properties, which is significant for studying regional and global ecological environments. However, retrieval errors exist in the extinction and backscattering coefficients detected by lidars. When the aerosol microphysical properties are retrieved, the number of unknown parameters required to be solved is often greater than that of optical measurement channels, which is a typical ill-posed inverse problem. As the retrieved results show significant uncertainty in some cases, additional constraints should be introduced to improve the retrieval stability. We propose an advanced regularization retrieval algorithm that introduces a priori mode radius range as a constraint to improve the retrieval accuracy of particle size distribution parameters of different aerosol types.MethodsIn our study, an advanced retrieval algorithm for aerosol microphysical properties based on the regularization method is developed. The entire algorithm process is shown in Fig. 1. Based on the Tikhonov regularization retrieval, the reliable retrieval of microphysical particle properties can be realized with a combined data set of particle backscattering coefficients at 355, 532, and 1064 nm and extinction coefficients at 355 nm and 532 nm. Generally, only those solutions for which the optical discrepancy term takes its minimum are selected in retrieval, but here all individual solutions that are within a certain range around this minimum solution are averaged. As a result, the retrieval stability can be improved. Additionally, referring to the aerosol models from the AERONET database, we obtain the volume mode radius ranges of coarse and fine mode aerosols. By employing this as a priori constraint, further selection is performed on the reconstructed particle size distribution to obtain the final retrieved results after averaging.Results and DiscussionsTo test the effectiveness of a priori mode radius constraints on improving the retrieval accuracy of particle size distribution, we conduct the simulations of four typical tropospheric aerosol types: (i) urban aerosols, (ii) smoke aerosols, (iii) desert dust aerosols, and (iv) marine aerosols, with parameters derived from observation data from several AERONET stations. Fig. 2 compares the distribution changes of reconstructed particle sizes after introducing a priori constraints. Meanwhile, Table 2 quantitatively compares the results in Fig. 2 by adopting mean relative errors as the evaluation index. The comparison results indicate that introducing mode radius constraints significantly improves the retrieval results of coarse mode aerosols. Referring to the range of aerosol microphysical parameters (Table 3) given in historical data, we generate 1500 sets of bimodal log-normal distribution data to test the algorithm. Considering the effect of 20% random Gaussian noise, the relative errors of the retrieved effective radius, volume concentration, and surface area concentration are controlled within the range of ±33%,±45%,and ±50% respectively in the cases over 90%. This indicates that the algorithm has sound stability and can tolerate input error effects within a certain range.ConclusionsWe propose an advanced retrieval algorithm for aerosol microphysical properties based on the regularization method, which significantly improves the stability and accuracy of retrieval and solves the problem of large retrieved errors in some cases. The proposed algorithm improves the remote detection technology of aerosols by multi-wavelength lidars. These measurements can provide accurate information about aerosol microphysical properties. The vertical profile of aerosol parameters obtained from lidar detection can be a great improvement of aerosol modeling, which will help study the influence of aerosols on climate and environment.
Acta Optica Sinica
- Publication Date: Mar. 25, 2024
- Vol. 44, Issue 6, 0601013 (2024)
Simulation and Error Analysis of Coherent Differential Absorption Carbon Dioxide Lidar
Yinying Li, Xiangcheng Chen, Cuirong Yu, Guangyao Dai, and Songhua Wu
ObjectiveSince the middle of the 20th century, due to the greenhouse effect, the global average surface temperature has increased by 0.85 ℃ between 1880 and 2012, and larger scale temperature increases have been investigated in some regions. Atmospheric carbon dioxide, as one of the important gases causing the greenhouse effect, plays an important role in global climate change. Due to the characteristics of large emissions and easy accumulation, carbon dioxide is often used as the main indicator of energy conservation and emission reduction. Understanding the spatiotemporal distribution pattern of atmospheric CO2 concentration in different regions can help to grasp the footprint of the“source”and“sink”of CO2 gas, which is conducive to achieving emission reduction control in China and accelerating the high-quality development of green and low carbon. The traditional methods of observing CO2 concentration use various meteorological satellites equipped with passive remote sensing observation instruments to observe the global large-scale CO2 concentration. However, passive remote sensing is limited by its observation characteristics, and there are problems such as difficult measurement at night, poor detection performance in high latitude regions, vulnerability to clouds and aerosols, and insufficient near-surface CO2 observation accuracy. As one of the active remote sensing technologies, coherent differential absorption lidar technology can work all day and detect with high accuracy. Compared to ground-based or airborne CO2 column concentration observation methods, it can provide CO2 concentration profile observation results with higher resolution. This observation method combines two technical systems, i.e., optical heterodyne and differential absorption, and can achieve high sensitivity, high integration, and diversified detection of atmospheric parameters. Coherent differential absorption lidar can obtain information about the vertical profile of carbon dioxide concentration and has the ability to detect point sources, cities, and key areas with high accuracy. However, its system structure is complex, and its development is difficult in the case of limited detection energy, with relatively little research. To assist in the parameter design of the lidar hardware system and explore the detection performance of the system, we explore the impact of atmospheric and optical parameter changes on the differential optical thickness calculation and theoretically analyze the error of the system in retrieving CO2 concentration.MethodsDifferential absorption optical thickness refers to the difference in the ratio of backscatter signals at two wavelengths in the carbon dioxide differential absorption lidar detection system. It represents the difference in the two laser backscatter signals caused by the absorption of carbon dioxide molecules and the absorption effect of carbon dioxide molecules on a specific emitted laser on the detection path. Using typical optical parameters of the lidar system and the atmospheric parameters, we simulate the backscatter signals at different detection altitudes within the range of 0-3 km and calculate the differential optical thickness for different distances. By setting a certain amount of deviation for the parameter model used, we explore the impact of these parameter changes on the accuracy of differential optical thickness calculation. In the pre-research stage of a micro pulse coherent differential absorption lidar system, the results of the error estimation are of great significance for the design of hardware system parameters and the evaluation of system performance. For the inversion of carbon dioxide concentration from monopulse backscatter signals, based on the differential absorption principle, it can be approximated that the aerosol backscattering and atmospheric extinction in the atmospheric environment remain constant. As a result, the instability of differential optical thickness caused by the hardware system acquisition can be ignored. We evaluate the detection performance of the system by exploring the relative system error caused by the uncertainty of relevant parameters in the carbon dioxide concentration inversion method.Results and DiscussionsThrough the simulation, we find that at different altitudes, the variation trend of differential optical thickness with the increase in wavelength offset is consistent, showing a trend of increasing first and then decreasing. This indicates that the absorption of probe laser energy at different altitudes increases first and then decreases with the increase in wavelength offset. In the altitude range of nearly 3.5 km, when the wavelength offset is less than 0.5 pm, the relative system error is less than 0.015%. As the wavelength offset increases, the relative system error of differential optical thickness at different heights also increases. At different altitudes, with the increase in temperature offset, the differential optical thickness also shows a downward trend. When the temperature deviation is less than 1 K, the relative system error of differential optical thickness for each altitude layer is less than 0.34%. The pressure measurement deviation does not have a specific impact on calculation results of differential optical thickness. Within the entire simulation range, the pressure offset has a small impact on the calculation of differential optical thickness, with an overall relative error of less than 0.008%. Aiming at the key parameters in the CO2 concentration inversion method for the coherent differential absorption lidar system, we investigate the error in CO2 concentration inversion caused by their uncertainty. The results show that the total error caused by each parameter for the system is 0.45%. If the average CO2 concentration in a certain distance is 4×10⁻⁴, the overall absolute error of the system is 1.8×10⁻⁶.ConclusionsWe introduce the simulation calculation and error analysis of micropulse coherent differential absorption lidar. For the typical system optical parameters and the atmospheric parameters, we conduct a simulation to obtain the backscatter signal detected by the lidar system and calculate differential optical thickness at different heights. By setting different offsets for the parameter model, we explore their impact on the accuracy of optical thickness calculation. In addition, we theoretically analyze the uncertainty errors of atmospheric parameters (atmospheric temperature, atmospheric pressure, and water vapor concentration) and the errors introduced by the wavelength drift of the lidar system for a certain altitude and distance database. In addition, the absolute errors of CO2 concentration inversion caused by these error sources are evaluated. These works are important in the pre-research stage of lidar systems, and the results of simulation calculations and error analysis are of great significance for hardware system parameter design and system performance evaluation. ObjectiveSince the middle of the 20th century, due to the greenhouse effect, the global average surface temperature has increased by 0.85 ℃ between 1880 and 2012, and larger scale temperature increases have been investigated in some regions. Atmospheric carbon dioxide, as one of the important gases causing the greenhouse effect, plays an important role in global climate change. Due to the characteristics of large emissions and easy accumulation, carbon dioxide is often used as the main indicator of energy conservation and emission reduction. Understanding the spatiotemporal distribution pattern of atmospheric CO2 concentration in different regions can help to grasp the footprint of the“source”and“sink”of CO2 gas, which is conducive to achieving emission reduction control in China and accelerating the high-quality development of green and low carbon. The traditional methods of observing CO2 concentration use various meteorological satellites equipped with passive remote sensing observation instruments to observe the global large-scale CO2 concentration. However, passive remote sensing is limited by its observation characteristics, and there are problems such as difficult measurement at night, poor detection performance in high latitude regions, vulnerability to clouds and aerosols, and insufficient near-surface CO2 observation accuracy. As one of the active remote sensing technologies, coherent differential absorption lidar technology can work all day and detect with high accuracy. Compared to ground-based or airborne CO2 column concentration observation methods, it can provide CO2 concentration profile observation results with higher resolution. This observation method combines two technical systems, i.e., optical heterodyne and differential absorption, and can achieve high sensitivity, high integration, and diversified detection of atmospheric parameters. Coherent differential absorption lidar can obtain information about the vertical profile of carbon dioxide concentration and has the ability to detect point sources, cities, and key areas with high accuracy. However, its system structure is complex, and its development is difficult in the case of limited detection energy, with relatively little research. To assist in the parameter design of the lidar hardware system and explore the detection performance of the system, we explore the impact of atmospheric and optical parameter changes on the differential optical thickness calculation and theoretically analyze the error of the system in retrieving CO2 concentration.MethodsDifferential absorption optical thickness refers to the difference in the ratio of backscatter signals at two wavelengths in the carbon dioxide differential absorption lidar detection system. It represents the difference in the two laser backscatter signals caused by the absorption of carbon dioxide molecules and the absorption effect of carbon dioxide molecules on a specific emitted laser on the detection path. Using typical optical parameters of the lidar system and the atmospheric parameters, we simulate the backscatter signals at different detection altitudes within the range of 0-3 km and calculate the differential optical thickness for different distances. By setting a certain amount of deviation for the parameter model used, we explore the impact of these parameter changes on the accuracy of differential optical thickness calculation. In the pre-research stage of a micro pulse coherent differential absorption lidar system, the results of the error estimation are of great significance for the design of hardware system parameters and the evaluation of system performance. For the inversion of carbon dioxide concentration from monopulse backscatter signals, based on the differential absorption principle, it can be approximated that the aerosol backscattering and atmospheric extinction in the atmospheric environment remain constant. As a result, the instability of differential optical thickness caused by the hardware system acquisition can be ignored. We evaluate the detection performance of the system by exploring the relative system error caused by the uncertainty of relevant parameters in the carbon dioxide concentration inversion method.Results and DiscussionsThrough the simulation, we find that at different altitudes, the variation trend of differential optical thickness with the increase in wavelength offset is consistent, showing a trend of increasing first and then decreasing. This indicates that the absorption of probe laser energy at different altitudes increases first and then decreases with the increase in wavelength offset. In the altitude range of nearly 3.5 km, when the wavelength offset is less than 0.5 pm, the relative system error is less than 0.015%. As the wavelength offset increases, the relative system error of differential optical thickness at different heights also increases. At different altitudes, with the increase in temperature offset, the differential optical thickness also shows a downward trend. When the temperature deviation is less than 1 K, the relative system error of differential optical thickness for each altitude layer is less than 0.34%. The pressure measurement deviation does not have a specific impact on calculation results of differential optical thickness. Within the entire simulation range, the pressure offset has a small impact on the calculation of differential optical thickness, with an overall relative error of less than 0.008%. Aiming at the key parameters in the CO2 concentration inversion method for the coherent differential absorption lidar system, we investigate the error in CO2 concentration inversion caused by their uncertainty. The results show that the total error caused by each parameter for the system is 0.45%. If the average CO2 concentration in a certain distance is 4×10⁻⁴, the overall absolute error of the system is 1.8×10⁻⁶.ConclusionsWe introduce the simulation calculation and error analysis of micropulse coherent differential absorption lidar. For the typical system optical parameters and the atmospheric parameters, we conduct a simulation to obtain the backscatter signal detected by the lidar system and calculate differential optical thickness at different heights. By setting different offsets for the parameter model, we explore their impact on the accuracy of optical thickness calculation. In addition, we theoretically analyze the uncertainty errors of atmospheric parameters (atmospheric temperature, atmospheric pressure, and water vapor concentration) and the errors introduced by the wavelength drift of the lidar system for a certain altitude and distance database. In addition, the absolute errors of CO2 concentration inversion caused by these error sources are evaluated. These works are important in the pre-research stage of lidar systems, and the results of simulation calculations and error analysis are of great significance for hardware system parameter design and system performance evaluation.
Acta Optica Sinica
- Publication Date: Mar. 25, 2024
- Vol. 44, Issue 6, 0601012 (2024)

Numerical Simulation of Summer Ozone in Hefei: Role of Solar Radiation and Its Associated Mechanisms
Mingjian Yi, Xuemei Huang, Yongqing Jiang, Qiang Zhao, Yi Li, and Shumei Deng
ObjectiveIn recent years, many cities in China have gradually changed from single-type particulate matter pollution to compound air pollution, with increasingly prominent ozone pollution in summer especially. The Yangtze River Delta where Hefei City is located is the region with the most serious ozone pollution in summer. Thus, we analyze in depth the changes in summer ozone concentrations and solar radiation intensity in Hefei by combining two experimental methods of observational analysis and numerical simulations to understand the possible correlations between them. Numerical modeling is also adopted to reproduce the daily variations in solar radiation intensity and ground-level ozone concentrations in different weather conditions. The contribution of each physicochemical process to ozone production is quantified by the process analysis techniques embedded in the model, and the details of the influence of gas-phase chemistry, dry and wet depositions, and diffusive transport on ozone concentrations in different weather conditions are distinguished. Our study is expected to explore the effect of solar radiation on ground-level ozone concentrations with the help of sophisticated observations and effective simulations to deepen the understanding about the intrinsic mechanism of solar radiation directly and indirectly affecting ozone concentrations. Finally, we can analyze the causes of urban ozone pollution in summer in a more scientific manner and provide a necessary theoretical basis for the effective prevention and control of ozone pollution.MethodsMS-711 is a new generation of all-weather grating spectroradiometer, which measures in the spectral range of 300-1100 nm with a spectral resolution of less than 7 nm. The data for the air quality model are obtained from the final operational global analysis (FNL) project, and the emission inventory of the pollutant sources is provided by the multiresolution emission inventory model for climate and air pollution research (MEIC). The ozone concentration data are obtained from the Hefei Ambient Air Quality Monitoring Station. WRF v4.1 and CAMx v7.10 are utilized for the numerical modeling of meteorological fields and air quality. The model employs a three-layer nested grid with grid side lengths of 27, 9, and 3 km, ranging from Northeast Asia, Eastern China, and Hefei City and its surroundings respectively. The WRF microphysics is the Morrison double-moment scheme, and the cumulus parameterization is the Grell 3D ensemble scheme. The gas phase chemistry mechanism of CAMx is CB05, and the secondary organic aerosol scheme is CF. We also leverage time-lagged correlation analysis (TLCC) to assess the relationship between solar radiation intensity and ground-level ozone concentrations. Meanwhile, TLCC is adopted to calculate the correlation of one time series with another at different points in time. We shift the ozone concentration series backward by a certain amount of time and then calculate the correlation coefficient between it and solar radiation intensity. The integrated process rate analysis (IPR) method is a process analysis technique that combines chemical kinetic modeling and statistical analysis methods embedded in the CAMx model. Additionally, we employ it to analyze the effects of a variety of chemical reactions and physical processes on ozone generation and elimination rates to determine the rates and understand the ozone generation and elimination mechanisms.Results and DiscussionThe observations and numerical simulations confirm that the zone peak of summer daytime occurs approximately 2-3 h after the peak solar radiation intensity (Fig. 3). From layer 1 to layer 5, the ozone concentrations increase gradually with the rising height (Fig. 5). The contributions of ozone sources in the near-surface layer (layer 1) are as follows. The vertical diffusion process from high altitude to the ground contributes a generation rate of +8.87×10⁻⁹ h-1, which is a main reason for ozone concentration increase, while the contribution of dry depositions is -8.12×10⁻⁹ h-1 and it is the main ozone scavenging process (Fig. 6). Layer 6-layer 7 correspond to altitudes of 1931-3371 m, and the main reason for low ozone concentrations is due to the rapidly decreased contribution of photochemical processes (Fig. 5). The ozone accumulation on sunny days comes from photochemical processes first, and when the solar radiation intensity decreases, the large input of ozone generated in the upper part of the boundary layer is the key factor in maintaining the ozone concentrations. However, the ozone concentrations maintain a slowly decreasing trend in the following hours due to the convection development in the late afternoon, which blocks subsidence [Fig. 7(a)]. On rainy days, Vc (contribution of chemical processes) values are small, slowly coming, and short-lived, while the significantly enhanced Vtp (contribution of diffusive transport at the upper interface) throughout the afternoon hours is the primary reason for the growth and maintenance of ozone concentrations [Fig. 7(b)]. On cloudy days, solar radiation dominates the ozone growth stage, and dry and wet depositions and horizontal fluxes dominate the ozone decline stage [Fig. 7(c)].ConclusionsThe vertical motion of the atmosphere exerts a significant effect on near-surface ozone concentrations. The ozone concentrations gradually increase from the ground up to approximately 1 km, with a positive contribution from the downward movement of the air that transports the high ozone concentration in the upper layers to the near-surface during sunny days and a negative contribution from the upward movement of the air that dilutes the ozone concentration in the air below the boundary layer during rainy days. The daily variations in ozone concentrations in different weather conditions are closely related to the contribution of several mechanisms. Solar radiation-driven photochemical reactions, diffusive transport, and wet and dry depositions affect ozone production at different moments and altitudes, and the process analysis results show that the quantitative contributions can explain the daily variability of ozone concentrations characterized by different weather conditions. ObjectiveIn recent years, many cities in China have gradually changed from single-type particulate matter pollution to compound air pollution, with increasingly prominent ozone pollution in summer especially. The Yangtze River Delta where Hefei City is located is the region with the most serious ozone pollution in summer. Thus, we analyze in depth the changes in summer ozone concentrations and solar radiation intensity in Hefei by combining two experimental methods of observational analysis and numerical simulations to understand the possible correlations between them. Numerical modeling is also adopted to reproduce the daily variations in solar radiation intensity and ground-level ozone concentrations in different weather conditions. The contribution of each physicochemical process to ozone production is quantified by the process analysis techniques embedded in the model, and the details of the influence of gas-phase chemistry, dry and wet depositions, and diffusive transport on ozone concentrations in different weather conditions are distinguished. Our study is expected to explore the effect of solar radiation on ground-level ozone concentrations with the help of sophisticated observations and effective simulations to deepen the understanding about the intrinsic mechanism of solar radiation directly and indirectly affecting ozone concentrations. Finally, we can analyze the causes of urban ozone pollution in summer in a more scientific manner and provide a necessary theoretical basis for the effective prevention and control of ozone pollution.MethodsMS-711 is a new generation of all-weather grating spectroradiometer, which measures in the spectral range of 300-1100 nm with a spectral resolution of less than 7 nm. The data for the air quality model are obtained from the final operational global analysis (FNL) project, and the emission inventory of the pollutant sources is provided by the multiresolution emission inventory model for climate and air pollution research (MEIC). The ozone concentration data are obtained from the Hefei Ambient Air Quality Monitoring Station. WRF v4.1 and CAMx v7.10 are utilized for the numerical modeling of meteorological fields and air quality. The model employs a three-layer nested grid with grid side lengths of 27, 9, and 3 km, ranging from Northeast Asia, Eastern China, and Hefei City and its surroundings respectively. The WRF microphysics is the Morrison double-moment scheme, and the cumulus parameterization is the Grell 3D ensemble scheme. The gas phase chemistry mechanism of CAMx is CB05, and the secondary organic aerosol scheme is CF. We also leverage time-lagged correlation analysis (TLCC) to assess the relationship between solar radiation intensity and ground-level ozone concentrations. Meanwhile, TLCC is adopted to calculate the correlation of one time series with another at different points in time. We shift the ozone concentration series backward by a certain amount of time and then calculate the correlation coefficient between it and solar radiation intensity. The integrated process rate analysis (IPR) method is a process analysis technique that combines chemical kinetic modeling and statistical analysis methods embedded in the CAMx model. Additionally, we employ it to analyze the effects of a variety of chemical reactions and physical processes on ozone generation and elimination rates to determine the rates and understand the ozone generation and elimination mechanisms.Results and DiscussionThe observations and numerical simulations confirm that the zone peak of summer daytime occurs approximately 2-3 h after the peak solar radiation intensity (Fig. 3). From layer 1 to layer 5, the ozone concentrations increase gradually with the rising height (Fig. 5). The contributions of ozone sources in the near-surface layer (layer 1) are as follows. The vertical diffusion process from high altitude to the ground contributes a generation rate of +8.87×10⁻⁹ h-1, which is a main reason for ozone concentration increase, while the contribution of dry depositions is -8.12×10⁻⁹ h-1 and it is the main ozone scavenging process (Fig. 6). Layer 6-layer 7 correspond to altitudes of 1931-3371 m, and the main reason for low ozone concentrations is due to the rapidly decreased contribution of photochemical processes (Fig. 5). The ozone accumulation on sunny days comes from photochemical processes first, and when the solar radiation intensity decreases, the large input of ozone generated in the upper part of the boundary layer is the key factor in maintaining the ozone concentrations. However, the ozone concentrations maintain a slowly decreasing trend in the following hours due to the convection development in the late afternoon, which blocks subsidence [Fig. 7(a)]. On rainy days, Vc (contribution of chemical processes) values are small, slowly coming, and short-lived, while the significantly enhanced Vtp (contribution of diffusive transport at the upper interface) throughout the afternoon hours is the primary reason for the growth and maintenance of ozone concentrations [Fig. 7(b)]. On cloudy days, solar radiation dominates the ozone growth stage, and dry and wet depositions and horizontal fluxes dominate the ozone decline stage [Fig. 7(c)].ConclusionsThe vertical motion of the atmosphere exerts a significant effect on near-surface ozone concentrations. The ozone concentrations gradually increase from the ground up to approximately 1 km, with a positive contribution from the downward movement of the air that transports the high ozone concentration in the upper layers to the near-surface during sunny days and a negative contribution from the upward movement of the air that dilutes the ozone concentration in the air below the boundary layer during rainy days. The daily variations in ozone concentrations in different weather conditions are closely related to the contribution of several mechanisms. Solar radiation-driven photochemical reactions, diffusive transport, and wet and dry depositions affect ozone production at different moments and altitudes, and the process analysis results show that the quantitative contributions can explain the daily variability of ozone concentrations characterized by different weather conditions.
Acta Optica Sinica
- Publication Date: Mar. 25, 2024
- Vol. 44, Issue 6, 0601011 (2024)
Comparison and Optimization of Ground-Level NO2 Concentration Estimation in China Based on TROPOMI and OMI
Wenyuan Zhou, Kai Qin, Qin He, Luyao Wang, Jinhong Luo, and Wolong Xie
ObjectiveNitrogen dioxide (NO2) in the atmosphere has an important impact on air quality and climate change, and ground-level NO2 will directly affect human health. China is one of the regions with high concentrations of NO2 in the world. Long-term surface NO2 concentration data has been provided by China Environmental Monitoring Station since 2013. In addition, the satellite data can make up for the lack of coverage of ground stations. Compared with the previous ozone detector (OMI) sensor, tropospheric detector (TROPOMI) has higher data coverage and spatial resolution, but its potential for ground-level NO2 estimation needs to be proved, and the underestimation of the estimation model predicting high-value samples needs to be optimized. The purpose of this paper is to use machine learning algorithms to estimate ground-level NO2 concentration in China based on satellite observation data and obtain 0.05-degree NO2 concentration raster data from 2014 to 2021. On this basis, a systematic comparative study is carried out on the difference in the estimation results of TROPOMI and OMI sensor observations, and an optimization model is established to optimize the underestimation of the conventional machine learning model in the high-value area.MethodsThe dataset in this paper contains the observations of ground-level NO2 concentration from ground stations, the tropospheric NO2 column concentration provided by OMI and TROPOMI which come from European Space Agency and Google Earth Engine, and auxiliary data that contains meteorological data of ERA5, population data, surface elevation data, and land use data. Data preprocessing includes assigning station data to the nearest grid and resampling data with different spatial resolutions to 0.05 degrees. The dataset and the algorithm are used to build a model with the algorithm named XGBoost, which is optimized on the basis of GBDT, so as to have higher prediction accuracy. The features of the model are selected by variance inflation factor (VIF) and analyzed by shapley additive explanation (SHAP) value. By comparing the temporal and spatial coverage of TROPOMI and OMI sensor observation data and comparing satellite imagery and estimation results for a specific area, we study the difference between these two data in estimating ground-level NO2 concentration. In addition, the estimation model is optimized by establishing an ensemble model that contains a classification model and a high-value prediction model.Results and DiscussionsUneven spatial distribution of ground stations will cause the estimation results to present the same value in the area with fewer ground stations, so the accuracy of estimation will be poor (Fig. 2). The VIF of features that connect with geographic information is much higher than the threshold, which is supposed to be 10, and the VIF of surface pressure and DSM is out of the threshold (Fig. 3). After comparing the correlation coefficient between the two and the surface observations and the update frequency of the two, we decide to remove the surface elevation and retain the surface pressure. Feature importance of the OMI data computed by SHAP value is 6.09, which is much more than those of others (Fig. 3). According to the Beeswarm from SHAP value of each feature, it can be found that when the observed value of OMI is higher, it will have a positive effect on the predicted value, or in other words, when the observed value of OMI is higher, it will lead to an increase in the predicted result, and when it is lower, it will make prediction results decrease (Fig. 3). The temporal and spatial resolution of TROPOMI data is higher than that of OMI (Fig. 4), and the machine learning accuracy evaluation index of the estimation result is better than that of OMI (Fig. 5). By comparing satellite observations and estimating specific regions with ground-based observations, it is found that TROPOMI data with higher spatial resolution can identify changes from spatial gradient that fails to be identified in OMI data, resulting in more accurate estimates (Fig. 6). By classifying high-value samples first and then building an additional high-value sample model for estimation, the optimized estimation model successfully increases the slope of the scatter diagram of the estimation results from 0.79 to 0.89, and the R2 increases from 0.79 to 0.85 (Fig. 7). It can also be seen from the image that the estimation results of the optimized model are closer to the ground observations (Fig. 8).Conclusions1) There is serious multicollinearity in the latitude and longitude information in the prediction model variables, which will affect the quality of model estimation; 2) The data coverage of TROPOMI is higher than that of OMI, and the estimation result is better than that of OMI, ten-fold cross-validation (R2: 0.79 VS 0.75, slope: 0.79 VS 0.74); 3) The high spatial resolution of TROPOMI can identify high or low NO2 near-surface areas that cannot be identified by OMI; 4) By establishing an integrated model and selecting high-value samples for separate processing, the prediction accuracy can be significantly improved; R2 is increased from 0.79 to 0.85, and the slope of the fitting line is increased from 0.79 to 0.89. ObjectiveNitrogen dioxide (NO2) in the atmosphere has an important impact on air quality and climate change, and ground-level NO2 will directly affect human health. China is one of the regions with high concentrations of NO2 in the world. Long-term surface NO2 concentration data has been provided by China Environmental Monitoring Station since 2013. In addition, the satellite data can make up for the lack of coverage of ground stations. Compared with the previous ozone detector (OMI) sensor, tropospheric detector (TROPOMI) has higher data coverage and spatial resolution, but its potential for ground-level NO2 estimation needs to be proved, and the underestimation of the estimation model predicting high-value samples needs to be optimized. The purpose of this paper is to use machine learning algorithms to estimate ground-level NO2 concentration in China based on satellite observation data and obtain 0.05-degree NO2 concentration raster data from 2014 to 2021. On this basis, a systematic comparative study is carried out on the difference in the estimation results of TROPOMI and OMI sensor observations, and an optimization model is established to optimize the underestimation of the conventional machine learning model in the high-value area.MethodsThe dataset in this paper contains the observations of ground-level NO2 concentration from ground stations, the tropospheric NO2 column concentration provided by OMI and TROPOMI which come from European Space Agency and Google Earth Engine, and auxiliary data that contains meteorological data of ERA5, population data, surface elevation data, and land use data. Data preprocessing includes assigning station data to the nearest grid and resampling data with different spatial resolutions to 0.05 degrees. The dataset and the algorithm are used to build a model with the algorithm named XGBoost, which is optimized on the basis of GBDT, so as to have higher prediction accuracy. The features of the model are selected by variance inflation factor (VIF) and analyzed by shapley additive explanation (SHAP) value. By comparing the temporal and spatial coverage of TROPOMI and OMI sensor observation data and comparing satellite imagery and estimation results for a specific area, we study the difference between these two data in estimating ground-level NO2 concentration. In addition, the estimation model is optimized by establishing an ensemble model that contains a classification model and a high-value prediction model.Results and DiscussionsUneven spatial distribution of ground stations will cause the estimation results to present the same value in the area with fewer ground stations, so the accuracy of estimation will be poor (Fig. 2). The VIF of features that connect with geographic information is much higher than the threshold, which is supposed to be 10, and the VIF of surface pressure and DSM is out of the threshold (Fig. 3). After comparing the correlation coefficient between the two and the surface observations and the update frequency of the two, we decide to remove the surface elevation and retain the surface pressure. Feature importance of the OMI data computed by SHAP value is 6.09, which is much more than those of others (Fig. 3). According to the Beeswarm from SHAP value of each feature, it can be found that when the observed value of OMI is higher, it will have a positive effect on the predicted value, or in other words, when the observed value of OMI is higher, it will lead to an increase in the predicted result, and when it is lower, it will make prediction results decrease (Fig. 3). The temporal and spatial resolution of TROPOMI data is higher than that of OMI (Fig. 4), and the machine learning accuracy evaluation index of the estimation result is better than that of OMI (Fig. 5). By comparing satellite observations and estimating specific regions with ground-based observations, it is found that TROPOMI data with higher spatial resolution can identify changes from spatial gradient that fails to be identified in OMI data, resulting in more accurate estimates (Fig. 6). By classifying high-value samples first and then building an additional high-value sample model for estimation, the optimized estimation model successfully increases the slope of the scatter diagram of the estimation results from 0.79 to 0.89, and the R2 increases from 0.79 to 0.85 (Fig. 7). It can also be seen from the image that the estimation results of the optimized model are closer to the ground observations (Fig. 8).Conclusions1) There is serious multicollinearity in the latitude and longitude information in the prediction model variables, which will affect the quality of model estimation; 2) The data coverage of TROPOMI is higher than that of OMI, and the estimation result is better than that of OMI, ten-fold cross-validation (R2: 0.79 VS 0.75, slope: 0.79 VS 0.74); 3) The high spatial resolution of TROPOMI can identify high or low NO2 near-surface areas that cannot be identified by OMI; 4) By establishing an integrated model and selecting high-value samples for separate processing, the prediction accuracy can be significantly improved; R2 is increased from 0.79 to 0.85, and the slope of the fitting line is increased from 0.79 to 0.89.
Acta Optica Sinica
- Publication Date: Mar. 25, 2024
- Vol. 44, Issue 6, 0601010 (2024)
Rapid Monitoring Method of Radionuclide in Water Based on Algae Fluorescence Kinetics
Xiaoxuan Tan, Tingting Gan, Ronghui Zhou, Gaofang Yin, Nanjing Zhao, Ying Wang, Ruoyu Sheng, Ziqi Ye, Ruiqi Zhang, and Xuyun Huang
ObjectiveWith the rapid development of nuclear energy and technology, more nuclear power plants are being built and operated worldwide. Due to the need for large amounts of cooling water, most nuclear power plants are located near coastal or inland rivers, which increases the risk of radioactive pollution in surrounding waters. Traditional detection methods of radionuclides in water often have some problems such as tedious detection processes and high detector costs. They also cannot reflect the toxic effect of radionuclides on organisms and do not meet the needs of in situ rapid detection of radionuclide pollution in water. Algae fluorescence induction kinetics technology has been widely used in toxicity detection of heavy metals, pesticides, and other pollutants in water in recent years due to its simplicity, rapidity, and non-destructive characteristics. However, it is still unknown whether the algae fluorescence induction kinetic technique can be applied to the field rapid detection of radionuclide toxicity in water. Therefore, we study the response rules and characteristics of algae rapid chlorophyll fluorescence induction kinetic line and commonly used photosynthetic fluorescence parameters to the short-term toxicity stress of three common radionuclides. In this way, we determine the feasibility of the application of algae fluorescence induction kinetic technique to the field detection of radionuclide toxicity in water.MethodsChlorella pyrenoidosa, a common freshwater green algae, is used as the test organism, and three typical radionuclide pollutants strontium (90Sr), cesium (137Cs) and cobalt (60Co) are studied. By using the fluorescence induction kinetics method, we study the toxicity response rules and characteristics of fast chlorophyll fluorescence induction kinetics (OJIP) curve, maximum photochemical quantum yield (Fv/Fm, where Fv is variable fluorescence, and Fm is maximal fluorescence) and photosystem II performance parameters (PIABS) under 180 min short-term stress of 90Sr, 137Cs and 60Co. The feasibility of the application of algae fluorescence induction kinetics technique to the rapid detection of radionuclide toxicity in water is determined. By establishing two photosynthetic fluorescence parameters and three radionuclides dose-response curves, we analyze the 20% effect concentration (EC20) and 50% effect concentration (EC50) of Fv/Fm and PIABS to further compare the toxicity response of Fv/Fm and PIABS to three radionuclides. Finally, we select the best toxicity response index which can be used for sensitive detection of radionuclide toxicity in water.Results and DiscussionsThe three radionuclides 90Sr, 137Cs, and 60Co can damage the photosynthetic system of chlorella pyrenoidosa and inhibit the activity of photosystem II and electron transfer, thereby inhibiting the photosynthesis of chlorella pyrenoidosa and finally leading to changes in the OJIP curve (Fig. 1). Therefore, microalgae fluorescence dynamics technology can be applied to the rapid detection of radionuclide toxicity in water. By studying the response characteristics of the photosynthetic fluorescence parameter Fv/Fm to the toxicity of three radionuclides 90Sr, 137Cs, and 60Co, we find that the inhibition degree of the three radionuclides to Fv/Fm is continuously enhanced within 180 min, and the toxic response of Fv/Fm to three radionuclides is activity concentration- and time-dependent (Fig. 2). The adjusted coefficient of determination (adj-R2) obtained by Logistic fitting curves between Fv/Fm inhibition rate and nuclides activity concentration are all greater than 0.9, indicating that the three radionuclides and Fv/Fm have good Logistic dose-response relationships (Fig. 3). Therefore, Fv/Fm can be well used in the detection and evaluation of radionuclide toxicity. Within 180 min of exposure, the photosynthetic fluorescence parameter PIABS has activity concentration- and time-dependent toxicity response to the three radionuclides (Fig. 4). The adj-R2 obtained by the Logistic fitting curves between PIABS inhibition rate and nuclides activity concentration are all greater than 0.9, indicating that the three radionuclides and PIABS also have good Logistic dose-response relationships (Fig. 5). Therefore, PIABS can be used in the detection and evaluation of radionuclide toxicity. In addition, by comparing the EC20 and EC50 values obtained based on the two photosynthetic fluorescence parameters, we find that the EC20 (Fig. 6) and EC50 values (Fig. 7) obtained based on Fv/Fm of the three radionuclides are greater than those obtained based on PIABS. It shows that the photosynthetic fluorescence parameter PIABS has more sensitive response characteristic to radionuclide toxicity than Fv/Fm.ConclusionsUnder short-term exposure for 180 min, three typical radionuclides 90Sr, 137Cs, and 60Co have significant toxic effects on the photosynthesis of chlorella pyrenoidosa, resulting in a significant change in the shape of OJIP curves and significant inhibition of photosynthetic fluorescence parameters Fv/Fm and PIABS of chlorella pyrenoidosa. Thus, the fluorescence induction kinetics of microalgae can be used for rapid detection of radionuclide toxicity in water. The two photosynthetic fluorescence parameters Fv/Fm and PIABS obtained based on fluorescence induction kinetics have good Logistic dose-response curves with 90Sr, 137Cs, and 60Co. They have a certain time-dependent response to the toxicity of 90Sr, 137Cs, and 60Co. Therefore, Fv/Fm and PIABS can be used as toxicity response indexes to detect radionuclide toxicity in water based on fluorescence kinetics. By comparison, the response sensitivity of PIABS to the toxicity of three radionuclides under short-term exposure for 180 min is significantly better than that of photosynthetic fluorescence parameter Fv/Fm. This indicates that PIABS is the best toxicity response index for sensitive detection of radionuclide toxicity in water based on microalgae fluorescence kinetic technique. Our study provides a method basis for the rapid detection of radionuclide toxicity in the water environment and a new idea for emergency monitoring and early warning of nuclear leakage accidents in inland nuclear power plants. It has practical significance for ensuring the safety of water ecological environment. ObjectiveWith the rapid development of nuclear energy and technology, more nuclear power plants are being built and operated worldwide. Due to the need for large amounts of cooling water, most nuclear power plants are located near coastal or inland rivers, which increases the risk of radioactive pollution in surrounding waters. Traditional detection methods of radionuclides in water often have some problems such as tedious detection processes and high detector costs. They also cannot reflect the toxic effect of radionuclides on organisms and do not meet the needs of in situ rapid detection of radionuclide pollution in water. Algae fluorescence induction kinetics technology has been widely used in toxicity detection of heavy metals, pesticides, and other pollutants in water in recent years due to its simplicity, rapidity, and non-destructive characteristics. However, it is still unknown whether the algae fluorescence induction kinetic technique can be applied to the field rapid detection of radionuclide toxicity in water. Therefore, we study the response rules and characteristics of algae rapid chlorophyll fluorescence induction kinetic line and commonly used photosynthetic fluorescence parameters to the short-term toxicity stress of three common radionuclides. In this way, we determine the feasibility of the application of algae fluorescence induction kinetic technique to the field detection of radionuclide toxicity in water.MethodsChlorella pyrenoidosa, a common freshwater green algae, is used as the test organism, and three typical radionuclide pollutants strontium (90Sr), cesium (137Cs) and cobalt (60Co) are studied. By using the fluorescence induction kinetics method, we study the toxicity response rules and characteristics of fast chlorophyll fluorescence induction kinetics (OJIP) curve, maximum photochemical quantum yield (Fv/Fm, where Fv is variable fluorescence, and Fm is maximal fluorescence) and photosystem II performance parameters (PIABS) under 180 min short-term stress of 90Sr, 137Cs and 60Co. The feasibility of the application of algae fluorescence induction kinetics technique to the rapid detection of radionuclide toxicity in water is determined. By establishing two photosynthetic fluorescence parameters and three radionuclides dose-response curves, we analyze the 20% effect concentration (EC20) and 50% effect concentration (EC50) of Fv/Fm and PIABS to further compare the toxicity response of Fv/Fm and PIABS to three radionuclides. Finally, we select the best toxicity response index which can be used for sensitive detection of radionuclide toxicity in water.Results and DiscussionsThe three radionuclides 90Sr, 137Cs, and 60Co can damage the photosynthetic system of chlorella pyrenoidosa and inhibit the activity of photosystem II and electron transfer, thereby inhibiting the photosynthesis of chlorella pyrenoidosa and finally leading to changes in the OJIP curve (Fig. 1). Therefore, microalgae fluorescence dynamics technology can be applied to the rapid detection of radionuclide toxicity in water. By studying the response characteristics of the photosynthetic fluorescence parameter Fv/Fm to the toxicity of three radionuclides 90Sr, 137Cs, and 60Co, we find that the inhibition degree of the three radionuclides to Fv/Fm is continuously enhanced within 180 min, and the toxic response of Fv/Fm to three radionuclides is activity concentration- and time-dependent (Fig. 2). The adjusted coefficient of determination (adj-R2) obtained by Logistic fitting curves between Fv/Fm inhibition rate and nuclides activity concentration are all greater than 0.9, indicating that the three radionuclides and Fv/Fm have good Logistic dose-response relationships (Fig. 3). Therefore, Fv/Fm can be well used in the detection and evaluation of radionuclide toxicity. Within 180 min of exposure, the photosynthetic fluorescence parameter PIABS has activity concentration- and time-dependent toxicity response to the three radionuclides (Fig. 4). The adj-R2 obtained by the Logistic fitting curves between PIABS inhibition rate and nuclides activity concentration are all greater than 0.9, indicating that the three radionuclides and PIABS also have good Logistic dose-response relationships (Fig. 5). Therefore, PIABS can be used in the detection and evaluation of radionuclide toxicity. In addition, by comparing the EC20 and EC50 values obtained based on the two photosynthetic fluorescence parameters, we find that the EC20 (Fig. 6) and EC50 values (Fig. 7) obtained based on Fv/Fm of the three radionuclides are greater than those obtained based on PIABS. It shows that the photosynthetic fluorescence parameter PIABS has more sensitive response characteristic to radionuclide toxicity than Fv/Fm.ConclusionsUnder short-term exposure for 180 min, three typical radionuclides 90Sr, 137Cs, and 60Co have significant toxic effects on the photosynthesis of chlorella pyrenoidosa, resulting in a significant change in the shape of OJIP curves and significant inhibition of photosynthetic fluorescence parameters Fv/Fm and PIABS of chlorella pyrenoidosa. Thus, the fluorescence induction kinetics of microalgae can be used for rapid detection of radionuclide toxicity in water. The two photosynthetic fluorescence parameters Fv/Fm and PIABS obtained based on fluorescence induction kinetics have good Logistic dose-response curves with 90Sr, 137Cs, and 60Co. They have a certain time-dependent response to the toxicity of 90Sr, 137Cs, and 60Co. Therefore, Fv/Fm and PIABS can be used as toxicity response indexes to detect radionuclide toxicity in water based on fluorescence kinetics. By comparison, the response sensitivity of PIABS to the toxicity of three radionuclides under short-term exposure for 180 min is significantly better than that of photosynthetic fluorescence parameter Fv/Fm. This indicates that PIABS is the best toxicity response index for sensitive detection of radionuclide toxicity in water based on microalgae fluorescence kinetic technique. Our study provides a method basis for the rapid detection of radionuclide toxicity in the water environment and a new idea for emergency monitoring and early warning of nuclear leakage accidents in inland nuclear power plants. It has practical significance for ensuring the safety of water ecological environment.
Acta Optica Sinica
- Publication Date: Mar. 25, 2024
- Vol. 44, Issue 6, 0601009 (2024)
Effects of Unstable Stratified Ocean Turbulence on Hermite-Gaussian Optical Communication System
Guixuan Ding, Xing Du, Hao Du, Sheng Wang, Lei Ao, and Cuichun Li
ObjectiveUnderwater wireless optical communication (UWOC) has caught much attention due to its wide frequency band, high information capacity, and fast data transmission rate. However, ocean turbulence causes light intensity scintillation during beam propagation, which increases the difficulty of optical signal resolution in UWOC systems. During establishing underwater optical communication links, Hermite-Gaussian (HG) beams can help to improve system performance by reducing scintillation. Most of the performance studies on current HG UWOC systems employ stable stratification turbulent power spectra, whose computational accuracy cannot match unstable stratification cases. Additionally, current research on UWOC is at the level where the system pointing error must be considered, but this aspect is not addressed in the study of the HG UWOC. According to the literature findings, the study of average bit error rate (BER), average channel capacity, and outage probability of UWOC systems based on unstable stratified ocean turbulence and HG beam pointing error is not reported. Therefore, we investigate the performance of the HG beam wireless optical communication system under unstable stratified ocean turbulence.MethodsWe derive the theoretical formulae for the HG optical scintillation index under unstable stratified ocean turbulence and the probability distribution function of the channel coefficients of UWOC systems considering the combined effects of ocean turbulence and pointing error. Meanwhile, theoretical formulae for the main performance parameters of the system are derived, including BER, channel capacity, and outage probability. Additionally, we derive the closed-form expressions for these three performance parameters using the Gaussian-Hermite orthogonal integral approximation method, thus conducting an in-depth analysis of the system performance. To more comprehensively evaluate the system performance in different conditions, we perform simulations to analyze the effects of beam modulus, transmission distance, ocean turbulence, and pointing error on the average BER, average channel capacity, and outage probability of the system under unstable stratification and stable stratification turbulence.Results and DiscussionsWe investigate the performance of HG beam wireless optical communication system under unstable stratified ocean turbulence. The results show that the system BER can be reduced by decreasing the beam width, the HG beam width is reduced from 0.05 m to 0.01 m at an SNR of 30 dB, and the average BER is reduced from 6.18×10⁻⁷ to 2.0×10⁻⁸. The increase in transmission distance results in the rising system BER. Additionally, we compare the differences in the effects of system performance on unstable stratification and stable stratification turbulence. It is found that the average BER for the stable stratification case in temperature-induced ocean turbulence is much lower than the average BER for the unstable stratification case. Since the eddy thermal diffusivity of seawater should be greater than the salt diffusivity in a temperature-induced ocean environment, the stable stratification assumption underestimates the ocean turbulence intensity. The system performance in the unstable stratification case is better when induced by salinity. Under the stable stratification assumption, the average channel capacity can be close to 0 in certain conditions to prevent reliable communication. In contrast, the average channel capacity in the unstable stratification case is greater than that in the stable stratification case. Meanwhile, the increase in the mean square temperature dissipation rate and the decrease in the turbulent kinetic energy dissipation rate per unit mass of fluid lead to decreased average channel capacity and increased outage probability. This indicates turbulence intensity increase, thus causing deteriorated system performance. Finally, as the variance of the pointing error increases, the light intensity at the receiver end becomes weaker and cannot meet the requirements of the resolved signals, with degraded system performance.ConclusionsWe investigate the performance of a wireless optical communication system using the HG beam under unstable stratified ocean turbulence. Meanwhile, The closed-form expressions for the scintillation index of the HG beams and the average BER, average channel capacity, and outage probability of the optical communication system which take into account the pointing error are derived from the power spectra of the unstable stratified ocean turbulence. The simulations analyze the effects of beam modulus, transmission distance, ocean turbulence, and pointing errors on the system performance. The results show that the unstable stratification theory can correct the bias of ocean turbulence intensity caused by the stable stratification assumption, and then reduce the calculation errors of BER, channel capacity, and outage probability of the UWOC system, and have better system performance in the salinity-induced cases. Additionally, the increasing mean square temperature dissipation rate leads to a decreasing turbulent kinetic energy dissipation rate per unit mass of fluid, rising pointing error, reducing system channel capacity, and increasing outage probability. The results have implications and significance for studying underwater optical communications. ObjectiveUnderwater wireless optical communication (UWOC) has caught much attention due to its wide frequency band, high information capacity, and fast data transmission rate. However, ocean turbulence causes light intensity scintillation during beam propagation, which increases the difficulty of optical signal resolution in UWOC systems. During establishing underwater optical communication links, Hermite-Gaussian (HG) beams can help to improve system performance by reducing scintillation. Most of the performance studies on current HG UWOC systems employ stable stratification turbulent power spectra, whose computational accuracy cannot match unstable stratification cases. Additionally, current research on UWOC is at the level where the system pointing error must be considered, but this aspect is not addressed in the study of the HG UWOC. According to the literature findings, the study of average bit error rate (BER), average channel capacity, and outage probability of UWOC systems based on unstable stratified ocean turbulence and HG beam pointing error is not reported. Therefore, we investigate the performance of the HG beam wireless optical communication system under unstable stratified ocean turbulence.MethodsWe derive the theoretical formulae for the HG optical scintillation index under unstable stratified ocean turbulence and the probability distribution function of the channel coefficients of UWOC systems considering the combined effects of ocean turbulence and pointing error. Meanwhile, theoretical formulae for the main performance parameters of the system are derived, including BER, channel capacity, and outage probability. Additionally, we derive the closed-form expressions for these three performance parameters using the Gaussian-Hermite orthogonal integral approximation method, thus conducting an in-depth analysis of the system performance. To more comprehensively evaluate the system performance in different conditions, we perform simulations to analyze the effects of beam modulus, transmission distance, ocean turbulence, and pointing error on the average BER, average channel capacity, and outage probability of the system under unstable stratification and stable stratification turbulence.Results and DiscussionsWe investigate the performance of HG beam wireless optical communication system under unstable stratified ocean turbulence. The results show that the system BER can be reduced by decreasing the beam width, the HG beam width is reduced from 0.05 m to 0.01 m at an SNR of 30 dB, and the average BER is reduced from 6.18×10⁻⁷ to 2.0×10⁻⁸. The increase in transmission distance results in the rising system BER. Additionally, we compare the differences in the effects of system performance on unstable stratification and stable stratification turbulence. It is found that the average BER for the stable stratification case in temperature-induced ocean turbulence is much lower than the average BER for the unstable stratification case. Since the eddy thermal diffusivity of seawater should be greater than the salt diffusivity in a temperature-induced ocean environment, the stable stratification assumption underestimates the ocean turbulence intensity. The system performance in the unstable stratification case is better when induced by salinity. Under the stable stratification assumption, the average channel capacity can be close to 0 in certain conditions to prevent reliable communication. In contrast, the average channel capacity in the unstable stratification case is greater than that in the stable stratification case. Meanwhile, the increase in the mean square temperature dissipation rate and the decrease in the turbulent kinetic energy dissipation rate per unit mass of fluid lead to decreased average channel capacity and increased outage probability. This indicates turbulence intensity increase, thus causing deteriorated system performance. Finally, as the variance of the pointing error increases, the light intensity at the receiver end becomes weaker and cannot meet the requirements of the resolved signals, with degraded system performance.ConclusionsWe investigate the performance of a wireless optical communication system using the HG beam under unstable stratified ocean turbulence. Meanwhile, The closed-form expressions for the scintillation index of the HG beams and the average BER, average channel capacity, and outage probability of the optical communication system which take into account the pointing error are derived from the power spectra of the unstable stratified ocean turbulence. The simulations analyze the effects of beam modulus, transmission distance, ocean turbulence, and pointing errors on the system performance. The results show that the unstable stratification theory can correct the bias of ocean turbulence intensity caused by the stable stratification assumption, and then reduce the calculation errors of BER, channel capacity, and outage probability of the UWOC system, and have better system performance in the salinity-induced cases. Additionally, the increasing mean square temperature dissipation rate leads to a decreasing turbulent kinetic energy dissipation rate per unit mass of fluid, rising pointing error, reducing system channel capacity, and increasing outage probability. The results have implications and significance for studying underwater optical communications.
Acta Optica Sinica
- Publication Date: Mar. 25, 2024
- Vol. 44, Issue 6, 0601008 (2024)
Error Correction for Cell Calibration of SO2 Ultraviolet Camera
Huiliang Zhang, Faquan Li, Juan Li, Houmao Wang, Zihao Zhang, Jianjun Guo, Kuijun Wu, and Weiwei He
ObjectiveIndustrial chimneys, ship exhaust, and volcanic eruption processes can emit large amounts of harmful SO2 into the atmosphere, causing serious pollution to the environment. The development of effective SO2 monitoring tools can provide a strong guarantee for atmospheric environmental management. In recent years, SO2 ultraviolet (UV) cameras have been rapidly developed and widely applied by virtue of their high spatio-temporal resolution, high detection sensitivity, and two-dimensional detection imaging capability. Due to the limitation of physical principles, the initial amount measured by the SO2 UV camera is the optical thickness of SO2 gas, which needs to be retrieved into a concentration image with the help of calibration curves, and the accuracy of calibration curves directly affects the accuracy of SO2 concentration results. Cell calibration and differential optical absorption spectroscopy (DOAS) calibration are two main methods for obtaining calibration curves. In terms of equipment cost, easy operation, and system stability, the cell method is significantly better than the DOAS method, but its calibration accuracy is seriously affected by the light dilution effect, reflections on the windows of the calibration cell and filter, and aerosol scattering factors. Additionally, with the rising detection distance, the above factors, especially the influence of the light dilution effect, become increasingly more serious. To improve the calibration accuracy of the cell method, we research the calibration error correction method to address the practical problem of inaccurate cell method calibration in remote SO2 monitoring.MethodsIn practice, since the factors affecting the accuracy of the cell method are mainly from the light dilution effect, window reflection, and the scattering of aerosols, it is necessary to correct each of these factors. The specific method is as follows. Firstly, the image correction method (ICM) is proposed for correcting the light dilution effect, and the extinction coefficient is obtained by fitting the intensity information of the measurement points at different distances in the UV camera images. Additionally, the optical thickness image of the cell at the measured distance is calculated by the extinction coefficient, and then the calibration curve with the correction of the light dilution effect is obtained. Then, based on the analysis of window reflection and aerosol scattering effect, the influence of the reflection effect and scattering characteristics on the calibration results are quantified. Finally, the calibration curves with the correction of light dilution effect and scattering characteristics are calculated by combining the above influencing factors.Results and DiscussionsBased on the Etna volcanic plume image data captured by Professor Jonas Gli? from the Norwegian Air Research Institute using a SO2 ultraviolet camera, the Etna volcanic plume SO2 concentration image is retrieved by calibration curves before and after the correction of the light dilution effect. The results are compared with the retrieval results of the DOAS calibration curve, and the results show that the correction of the light dilution effect can reduce the differences between the cell method and the DOAS method from 59.0% to 31.3%, which verifies the effectiveness of ICM in correcting light dilution effect. After correction for reflection and scattering effects, the difference between the cell method and the DOAS method is reduced to 7%. The cell method and DOAS method show good agreement in the time domain after correction, and the fitting curve slope of the primary function of the calibration results is 0.924, with a goodness-of-fit of 0.998.ConclusionsThe results show that the proposed error correction method for cell calibration of the SO2 UV camera can improve the calibration curve accuracy. The fitting accuracy of the extinction coefficient and the measurement accuracy of the filter reflectance and the quartz window directly affect the accuracy of the calibration curve. The error analysis results show that a 10% shift in the extinction coefficients εA and εB obtained from channels A and B fitting will cause an error of 8.44% and 13.57% for SO2 column density retrieval respectively, while a 10% shift in background light intensity will result in an error of 4.98% for SO2 column density retrieval. Additionally, a 10% error in the filter reflectance and the quartz window will result in a 6.26% and 1.95% shift in the SO2 column density respectively. Increasing the interval distance of sampling points and the number of sampling points can improve the fitting accuracy of the extinction coefficient. The high-resolution UV spectrometer ensures that the filter reflectance and the quartz window are accurately measured to control errors caused by the reflectance uncertainty. The proposed error correction method for calibration curves solves the limitation that the cell method cannot be applied to monitor the plumes at long distances and high carbon black concentrations, which is important for better applications of SO2 UV cameras in volcanoes, ships, and industrial chimneys. ObjectiveIndustrial chimneys, ship exhaust, and volcanic eruption processes can emit large amounts of harmful SO2 into the atmosphere, causing serious pollution to the environment. The development of effective SO2 monitoring tools can provide a strong guarantee for atmospheric environmental management. In recent years, SO2 ultraviolet (UV) cameras have been rapidly developed and widely applied by virtue of their high spatio-temporal resolution, high detection sensitivity, and two-dimensional detection imaging capability. Due to the limitation of physical principles, the initial amount measured by the SO2 UV camera is the optical thickness of SO2 gas, which needs to be retrieved into a concentration image with the help of calibration curves, and the accuracy of calibration curves directly affects the accuracy of SO2 concentration results. Cell calibration and differential optical absorption spectroscopy (DOAS) calibration are two main methods for obtaining calibration curves. In terms of equipment cost, easy operation, and system stability, the cell method is significantly better than the DOAS method, but its calibration accuracy is seriously affected by the light dilution effect, reflections on the windows of the calibration cell and filter, and aerosol scattering factors. Additionally, with the rising detection distance, the above factors, especially the influence of the light dilution effect, become increasingly more serious. To improve the calibration accuracy of the cell method, we research the calibration error correction method to address the practical problem of inaccurate cell method calibration in remote SO2 monitoring.MethodsIn practice, since the factors affecting the accuracy of the cell method are mainly from the light dilution effect, window reflection, and the scattering of aerosols, it is necessary to correct each of these factors. The specific method is as follows. Firstly, the image correction method (ICM) is proposed for correcting the light dilution effect, and the extinction coefficient is obtained by fitting the intensity information of the measurement points at different distances in the UV camera images. Additionally, the optical thickness image of the cell at the measured distance is calculated by the extinction coefficient, and then the calibration curve with the correction of the light dilution effect is obtained. Then, based on the analysis of window reflection and aerosol scattering effect, the influence of the reflection effect and scattering characteristics on the calibration results are quantified. Finally, the calibration curves with the correction of light dilution effect and scattering characteristics are calculated by combining the above influencing factors.Results and DiscussionsBased on the Etna volcanic plume image data captured by Professor Jonas Gli? from the Norwegian Air Research Institute using a SO2 ultraviolet camera, the Etna volcanic plume SO2 concentration image is retrieved by calibration curves before and after the correction of the light dilution effect. The results are compared with the retrieval results of the DOAS calibration curve, and the results show that the correction of the light dilution effect can reduce the differences between the cell method and the DOAS method from 59.0% to 31.3%, which verifies the effectiveness of ICM in correcting light dilution effect. After correction for reflection and scattering effects, the difference between the cell method and the DOAS method is reduced to 7%. The cell method and DOAS method show good agreement in the time domain after correction, and the fitting curve slope of the primary function of the calibration results is 0.924, with a goodness-of-fit of 0.998.ConclusionsThe results show that the proposed error correction method for cell calibration of the SO2 UV camera can improve the calibration curve accuracy. The fitting accuracy of the extinction coefficient and the measurement accuracy of the filter reflectance and the quartz window directly affect the accuracy of the calibration curve. The error analysis results show that a 10% shift in the extinction coefficients εA and εB obtained from channels A and B fitting will cause an error of 8.44% and 13.57% for SO2 column density retrieval respectively, while a 10% shift in background light intensity will result in an error of 4.98% for SO2 column density retrieval. Additionally, a 10% error in the filter reflectance and the quartz window will result in a 6.26% and 1.95% shift in the SO2 column density respectively. Increasing the interval distance of sampling points and the number of sampling points can improve the fitting accuracy of the extinction coefficient. The high-resolution UV spectrometer ensures that the filter reflectance and the quartz window are accurately measured to control errors caused by the reflectance uncertainty. The proposed error correction method for calibration curves solves the limitation that the cell method cannot be applied to monitor the plumes at long distances and high carbon black concentrations, which is important for better applications of SO2 UV cameras in volcanoes, ships, and industrial chimneys.
Acta Optica Sinica
- Publication Date: Mar. 25, 2024
- Vol. 44, Issue 6, 0601007 (2024)
Topics
© Copyright 2018-2021 | Chinese Laser Press. All Rights Reserved 沪ICP备15018463号-20